 |

|
| The Office of Motor Carrier and Highway Safety: An Analysis-Driven Organization |
|
|
| The Office of Motor Carrier and Highway Safety: An Analysis-Driven Organization |
In This Issue |
dale.sienicki@fhwa.dot.gov MCSAFE is a recurring publication of OMCHS’s Data Analysis Division. It is intended to provide OMCHS staff and other stakeholders in the motor carrier and highway safety environment with descriptive statistics and analyses about traffic crashes involving commercial motor vehicles and the programs and countermeasures OMCHS has implemented to promote motor carrier and highway safety. |
Other highlights of this issue include: a look at the OMCHS fact sheet on construction and maintenance work zone safety (Go to Article); a summary of information from the OMCHS publication Large Truck Crash Profile: The 1997 Picture (Go to Article); and an overview of 20-year fatal crash trends (Go to Article).
The Data Analysis Division of the Office of Motor Carrier and Highway Safety (OMCHS, HMIA-20) annually conducts a survey to measure the percentage of drivers with commercial driver’s licenses (CDLs) who test positive for controlled substances (henceforth referred to as “drugs”) and/or alcohol in random and nonrandom (pre-employment, post-crash, and reasonable suspicion) testing. This article reports on the 1997 survey.
All motor carriers that employ drivers with CDLs are required to have drug and alcohol testing programs. Each year, such carriers must randomly test 10% of their CDL drivers for alcohol and 50% of their CDL drivers for drugs. In addition, FHWA requires that motor carriers perform nonrandom drug and alcohol testing in cases where (1) the driver is being considered for employment (only for drugs and only when the driver has not recently been in a drug and alcohol testing program); (2) the driver has been involved in a crash (only when the crash involves a fatality, or when the CDL driver receives a citation in a towaway- or injury-related crash); or (3) the CDL driver is suspected by a supervisor of using drugs or alcohol while at work.
In the case of alcohol, a driver is considered to have tested positive if the blood alcohol content is 0.04 grams per 210 liters of breath, or higher. For drugs (marijuana, cocaine, opiates, amphetamines, and PCP) the cutoff levels for identifying use are based on guidelines set by the U.S. Department of Health and Human Services.
The positive usage rates developed by the survey and presented below represent weighted statistical estimates. These estimates are generalizable to the entire population of CDL drivers in the national fleet and have been derived using standard statistical techniques applicable to stratified samples. It is important to keep in mind that rates obtained from these procedures do not represent “true values,” but rather unbiased estimates of the true rates, with associated sampling errors.
Estimates of positive usage rates from both random and nonrandom testing are discussed separately below and presented in Table 1 (drugs) and Table 2 (alcohol). The tables also include estimates from the 1995 and 1996 surveys.
For the 1997 survey, data collection forms were sent to 4,008 randomly selected motor carriers; 2,941 of the forms were completed and returned to OMCHS, resulting in usable drug testing data from 1,462 motor carriers (comprising 228,138 CDL drivers), as well as usable alcohol testing data from 1,294 motor carriers (comprising 112,730 CDL drivers). Respondents with non-usable data represent entities that are out of business, exempt, have no testing program in place, or belong to consortia that did not test any drivers for the motor carrier during 1997. Based on these respondents, the OMCHS estimates from random testing are as follows:
Estimates of positive usage rates from nonrandom drug testing are shown in Table 1. Rates from nonrandom alcohol testing are shown in Table 2. With the possible exception of preemployment and post-crash (nonfatal) drug and alcohol testing, the sample sizes achieved in the survey for the various non-random testing categories are much lower than those achieved for random testing. As a result, the estimated precision level of many of these estimates is low. Given the achieved levels of precision in the 1996 and 1997 estimates, year-to-year differences in non-random testing rates between these two years cannot be shown to be statistically significant.
In cases where the estimated rate in the table is zero and the standard error is missing, no drivers in the sample tested positive for the particular category. In such cases, the actual positive rate for the population is, in all likelihood, greater than zero, but the sample size was inadequate to produce a more precise estimate.
| Table
1
Estimates of Random and Nonrandom Drug Usage Rates for 1995, 1996, and 1997 |
||||||
| Category | 1995 Estimate | 1995 Standard Error | 1996 Estimate | 1996 Standard Error | 1997 Estimate | 1997 Standard Error |
|---|---|---|---|---|---|---|
| Random Testing | 2.8% | 0.5% | 2.2% | 0.4% | 1.3% | 0.16% |
| Nonrandom: | ||||||
| Pre-employment | 3.0% | 0.3% | 2.4% | 0.3% | 2.0% | 0.15% |
| Post-Crash Nonfatal | 4.2% | 1.0% | 3.9% | 1.6% | 5.5% | 2.2% |
| Post-Crash Fatal | * | 0.6% | * | 47.0% | * | 0.02% |
| Reasonable Suspicion | 25.0% | 11.0% | * | 92.0% | * | 6.9% |
| Return to Duty | 1.0% | 0.3% | * | 8.1% | 0.2% | 0.08% |
| Followup | 4.0% | 1.5% | * | 6.7% | * | 1.9% |
| * Indicates extremely low precision. | ||||||
| Table
2
Estimates of Random and Nonrandom Alcohol Usage Rates for 1995, 1996, and 1997 |
||||||
| Category | 1995 Estimate | 1995 Standard Error | 1996 Estimate | 1996 Standard Error | 1997 Estimate | 1997 Standard Error |
|---|---|---|---|---|---|---|
| Random Testing | 0.14% | 0.02% | 0.2% | 0.03% | * | 0.1% |
| Nonrandom: | ||||||
| Pre-employment | * | 5.0% | * | -- | * | 0.005% |
| Post-Crash Nonfatal | * | 0.2% | * | 0.2% | 0.01% | 0.004% |
| Post-Crash Fatal | * | -- | * | 1.2% | * | 0.01% |
| Reasonable Suspicion | 34.0% | 3.0% | * | 19.0% | * | 7.8% |
| Return to Duty | 0.4% | 0.3% | * | -- | * | -- |
| Followup | 0.1% | 0.1% | * | 0.2% | * | 0.015% |
| * Indicates extremely low precision. | ||||||
For more information about the OMCHS drug and alcohol surveys, contact Richard Gruberg at (202) 366-2959 or Terry Shelton at (202) 366-1861.
The January 1999 issue of the MCSAFE newsletter presented readers with up-to-date summarized results of 1998’s International Highway Transportation Safety (IHTS) Week inspection activities. Additional data, reflecting complete Canadian jurisdictional results during the June 1-6, 1998 operation, have become available to the editor and are summarized in the table below.
| 1998 Canadian IHTS Week Level 1 Inspection Activities | |||||||||
| Jurisdiction | Trucks Inspected | Trucks OOS | % Trucks OOS | Pass Trucksa | OOS Rate (Including Pass Trucks)b | Trucks Towed Awayc | % Trucks Towed | Driver OOS | % Driver OOS |
|---|---|---|---|---|---|---|---|---|---|
| British Columbia | 986 | 201 | 20 | 350 | 15 | 42 | 4 | 21 | 2.1 |
| Alberta | 755 | 163 | 22 | 525 | 13 | 30 | 4 | 28 | 3.7 |
| Saskatchewan | 311 | 57 | 18 | 90 | 14 | 32 | 10 | 15 | 4.8 |
| Manitoba | 444 | 87 | 20 | 137 | 15 | 45 | 10 | 6 | 1.4 |
| Ontario | 2,824 | 814 | 29 | 2,363 | 16 | 46 | 2 | 23 | 0.8 |
| Quebec | 1,001 | 258 | 26 | 0 | 26 | 20 | 2 | 27 | 2.7 |
| New Brunswick | 314 | 59 | 28 | 20 | 25 | 0 | 0 | 3 | 1.4 |
| Prince Edward Island | 25 | 3 | 12 | 4 | 10 | 1 | 4 | 1 | 4.0 |
| Nova Scotia | 616 | 79 | 13 | 27 | 12 | 79 | 13 | 0 | 0.0 |
| Newfoundland | 200 | 40 | 20 | 28 | 18 | 23 | 12 | 5 | 2.5 |
| Yukon Territory | 107 | 27 | 35 | 39 | 18 | 21 | 20 | 3 | 2.8 |
| Northwest Territories | 93 | 20 | 22 | 71 | 12 | 13 | 14 | 3 | 3.2 |
| Canadian Totals | 7,576 | 1,808 | 24 | 3,654 | 16 | 352 | 5 | 135 | 1.8 |
|
aTrucks that would have been inspected had they not had valid Commercial Vehicle Safety
Alliance (CVSA) decals. bOOS Rate when “pass trucks” are included. cTrucks towed away or requiring repairs by mechanic before leaving site. | |||||||||
| A work zone crash is a motor vehicle traffic crash occurring in the vicinity of highway construction, highway maintenance, or utility work. |
The safe and efficient flow of traffic through construction and maintenance work zones is of major concern to the Office of Motor Carrier and Highway Safety (OMCHS). This issue impacts all four major focus areas of OMCHS: running off the road; motor carrier safety; pedestrian safety; and speed management. Understanding how, where, and when work zone crashes occur will assist OMCHS in creating effective countermeasures to prevent these crashes in the future.
OMCHS has prepared a fact sheet containing descriptive statistics for work zone motor vehicle crashes. The two tables at the right exemplify the information available in the fact sheet.
As shown in Table 1, over the past 5 years the number of people killed in motor vehicle crashes in work zones has gone from a high of 828 in 1994 to a low of 658 in 1997, averaging 751 per year. In 1997, 658 fatalities resulted from motor vehicle crashes in work zones—about 2% of total fatalities (42,013).
As shown in Table 2, 171 fatalities resulted from large truck crashes in work zones in 1997—about 3% of fatalities in large truck crashes (5,355). Twenty-six percent of work zone fatalities in 1997 resulted from large truck crashes (171 out of 658). From 1993 to 1997, an average of 191 people were killed in fatal large truck motor vehicle crashes in areas designated as work zones, from a high of 221 deaths in 1994 to a low of 171 deaths in 1997. On average from 1993 to 1997, 16% of the fatalities resulting from crashes in work zones were nonmotorists (pedestrians, bicyclists, etc.). Similarly, in large truck work zone crashes during the same time period, 16% of the fatalities were nonmotorists.
Statistics presented in the fact sheet for fatal crashes are derived from the National Highway Traffic Safety Administration’s (NHTSA) Fatality Analysis Reporting System. Descriptive statistics for nonfatal crashes are derived from NHTSA’s General Estimates System.
|
Table 1
Fatalities in Work Zone Crashes by Person Type, 1993-1997 |
||||||
| Person Type | 1993 | 1994 | 1995 | 1996 | 1997 | 5-Year Average |
|---|---|---|---|---|---|---|
| Motor Vehicle Occupant | 647 | 700 | 652 | 584 | 567 | 630 (84%) |
| Nonmotorist | 117 | 128 | 137 | 133 | 91 | 121 (16%) |
| Total | 764 | 828 | 789 | 717 | 658 | 751 (100%) |
| Source: National Highway Traffic Safety Administration, Fatality Analysis Reporting System. | ||||||
|
Table 2
Fatalities in Large Truck Work Zone Crashes by Person Type, 1993-1997 |
||||||
| Person Type | 1993 | 1994 | 1995 | 1996 | 1997 | 5-Year Average |
|---|---|---|---|---|---|---|
| Truck Occupant | 26 | 23 | 21 | 23 | 16 | 24 (12%) |
| Other Vehicle Occupant | 137 | 165 | 151 | 128 | 135 | 137 (72%) |
| Nonmotorist | 41 | 33 | 29 | 25 | 20 | 31 (16%) |
| Total | 204 | 221 | 191 | 176 | 171 | 191 (100%) |
| Source: National Highway Traffic Safety Administration, Fatality Analysis Reporting System. | ||||||
Copies of the Work Zone Crashes Fact Sheet may be obtained by contacting Ms. Sheila Robinson of the OMCHS Data Analysis Division (HMIA-20) at (202) 366-8593.
In September 1998, the OMCHS Data Analysis Division published Large Truck Crash Profile: The 1997 National Picture. This document contains descriptive statistics about fatal and nonfatal (injury and property-damage-only) large truck crashes that occurred in 1997. The following summarizes some of the information contained in the national profile. Please note that since the publication of the national profile, the 1997 FARS data file has been updated. In some cases, the numbers appearing in this article differ from those published in the profile.
For a copy of the complete Large Truck Crash Profile: The 1997 National Picture, call Lisa Harris at (202) 366-1861. To view the profile on the World Wide Web, go to: fhwa.dot.gov/omc/omchome, and click on “News and Events.” The profile is listed under this section in PDF format.
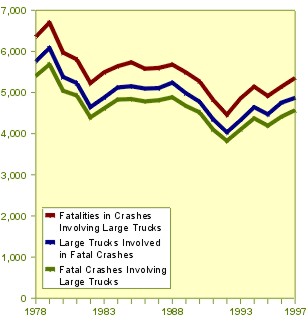
The data table and graphs below show 20-year trend data for fatalities and fatal crashes involving large trucks. Table 1 and Figure 1 show 20-year trend data (1978-1997) reflecting fatalities in crashes involving large trucks, large trucks involved in fatal crashes, and fatal crashes involving large trucks:
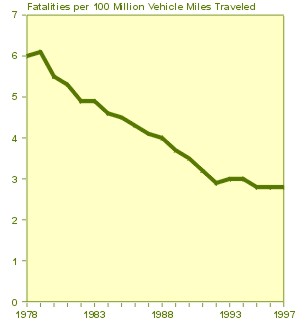
Figure 2 shows 20-year trend data reflecting fatalities in crashes involving large trucks per 100 million vehicle miles traveled. The rate has dropped by 53.3%, from 6.0 in 1978 to 2.8 in 1997.
|
Figure 1
Large Truck Fatal Crash Statistics, 1978-1997 |
 D
D
|
|
Figure 2
Large Truck Fatality Rate, 1978-1997 |
 D
D |
| Information on large truck and motor coach crashes and the nature and effectiveness of the Office of Motor Carrier and Highway Safety's safety programs is available from: |
| Employees operating in
the States
served by the Eastern Resource Center should contact Richard Gruberg, (202) 366-2959. |
 |
 |
Employees operating in
the States
served by the Southern Resource Center should contact Ralph Craft, (202) 366-0324. |
| Employees operating in
the States
served by the Midwest Resource Center should contact Chuck Rombro, (202) 366-5615. |
 |
 |
Employees operating in
the States
served by the Western Resource Center should contact Dale Sienicki, (202) 366-9039 Fax: (413) 771-0241. |
|
To obtain assistance in the application and interpretation of statistics, please call Richard Gruberg, (202) 366-2959. |
|
| DON’T FORGET TO LOOK FOR THE NEXT ISSUE OF MCSAFE! |
Home |
Feedback |
Site Map |
What's New |
Site Guide
Privacy Policy | Accessibility |
DOT User