
Large Truck Crash Overview 2011

Publication No. FMCSA-RRA-13-002
October 2013
The mission of the Federal Motor Carrier Safety Administration (FMCSA)
is to save lives by reducing crashes, injuries, and fatalities involving
commercial vehicles on our Nation’s highways. In 2011, there were:
-
3,341 large truck fatal crashes
-
3,608 large trucks in fatal crashes
-
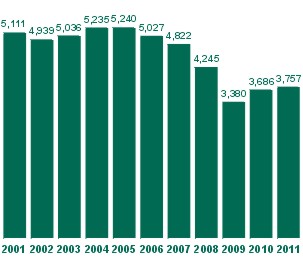
3,757 people killed in large truck fatal crashes (see Figure 1 for fatalities
trend, 2001–2011).
Figure 1. Fatalities in Crashes Involving Large Trucks
Another 88,000 people were injured in crashes involving large trucks. Seventeen
percent of those killed, and 26% of those injured, were occupants of large
trucks.
Trends
-
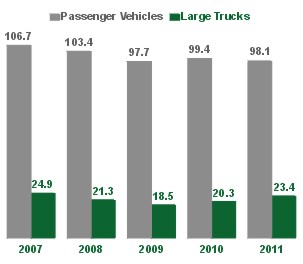
Trucks Involved in Fatal Crashes.
From 2001 through 2011, the number of
large trucks involved in fatal crashes dropped from 4,823 to 3,608—down
by 25%. From 2007 through 2011, the number of large trucks in fatal crashes
per 100 million vehicle miles traveled by large trucks declined from 1.52
to 1.35—down 11%. The corresponding rate for passenger vehicles fell from
1.66 to 1.29—a decline of 22% (Figure 2).
Figure 2. Vehicles Involved in Fatal Crashes per 100 Million Vehicle Miles Traveled by Vehicle Type

-
Trucks Involved in Injury Crashes.
From 2007 through 2011, the number of
large trucks involved in nonfatal injury crashes per 100 million vehicle
miles traveled by large trucks declined by 6%, while the rate for passenger
vehicles dropped by 8% (Figure 3).
Figure 3. Vehicles Involved in Injury Crashes per 100 Million Vehicle Miles Traveled by Vehicle Type
Drivers
-
Of the drivers of large trucks in fatal crashes, 2.5% had a blood alcohol
content (BAC) of 0.01 grams per deciliter (g/dl) or greater. Any measurable
BAC for a large truck driver is an FMCSA out-of-service violation.
-
Eighty-three percent of the drivers of large trucks involved in fatal crashes
were reported by police as wearing their safety belts, compared with 65%
of passenger vehicle drivers involved in fatal crashes.
-
In fatal crashes involving large trucks, driver-related factors were recorded
for 34% of the large truck drivers.
-
The top five driver-related factors for large trucks in fatal crashes were,
in descending order, speeding-related, distraction/inattention, impairment
(fatigue, alcohol, illness, etc.), failure to keep in proper lane, and
vision obscured.
Vehicles
-
In 2011, large trucks accounted for 9% of all vehicle miles traveled and
4% of all registered vehicles in the United States. In motor vehicle crashes,
large trucks represented:
-
8% of vehicles in fatal crashes
-
2% of vehicles in injury crashes
-
3% of vehicles in property-damage-only crashes.
-
Large truck tractors pulling semi-trailers accounted for 61% of the large
trucks involved in fatal crashes and 47% of the large trucks involved in
nonfatal crashes.
-
Doubles (truck tractors pulling a semi-trailer and a full trailer) accounted
for 3% of large trucks involved in fatal and nonfatal crashes. Triples (truck
tractors pulling three trailers) accounted for 0.1% of all large trucks
involved in fatal and nonfatal crashes.
-
Four percent of large trucks involved in fatal crashes and 2% of large
trucks involved in nonfatal crashes were carrying hazardous materials (HM).
HM was released from the cargo compartment in 35% of the HM fatal crashes
and 10% of the HM nonfatal crashes.
-
Four percent of large trucks in fatal crashes were coded with vehicle-related
crash factors. Brakes and tires accounted for more than 50% of the factors
coded.
Crashes
-
Adverse weather conditions were reported for 12% of the fatal and nonfatal
crashes involving large trucks. Rain was the most common adverse weather
condition.
-
In 72% of fatal crashes involving large trucks and 85% of injury crashes
involving large trucks, the first harmful event (the first event during
a crash that caused injury or property damage) was a collision with another
motor vehicle. Passenger vehicles were involved in 88% of these fatal crashes
and 96% of these injury crashes.
-
For two-vehicle fatal crashes in 2011 involving a large truck and a passenger
vehicle:
-
Of the 364 fatal head-on crashes, the large truck crossed the center line
in 11% and the passenger vehicle crossed the center line in 89% of the
crashes.
-
Of the 307 fatal rear-end crashes, the large truck hit the passenger vehicle
in the rear in 26% and the passenger vehicle hit the large truck in the
rear in 74% of the crashes.
-
Rollover was the first harmful event for 5% of the fatal crashes and 2%
of the nonfatal crashes involving large trucks.
-
Of the 530 fatal crashes that took place in work zones—areas of construction,
maintenance, or utility activity—144 (27%) involved at least one large
truck. A total of 174 large trucks were involved in fatal work zone crashes.
Definitions
Large Trucks: Trucks over 10,000 pounds
gross vehicle weight rating (GVWR).
Passenger Vehicles: Passenger cars and
light trucks—vans, sport utility vehicles, and pickup trucks—with
10,000 pounds GVWR or less.
Data Sources
Fatal Crash Data: National Highway Traffic Safety
Administration, Fatality Analysis Reporting System (FARS).
Nonfatal Crash Data: National Highway Traffic
Safety Administration, General Estimates System (GES); and FMCSA, Motor Carrier
Management Information System (MCMIS) crash file, as of November 16, 2012.
Vehicle Miles Traveled and Registered Vehicles:
Federal Highway Administration, Highway Statistics 2011.
For more information, contact the Analysis Division at (202) 366-4869,
or visit our Web sites at www.fmcsa.dot.gov and ai.volpe.dot.gov.