1999 Work Zone Traffic Crash Facts

Prepared by:
Analysis Division
Federal Motor Carrier Safety Administration
U.S. Department of Transportation
Washington, D.C.
April 2001

1999 Work Zone
Traffic Crash Fact Summary
· The number of
people killed in motor vehicle crashes that occur in work zones averaged 768
from 1995 to 1999.
· On average
from 1995 to 1999, 16% of the fatalities resulting from crashes
in work
zones involved non-motorists (pedestrians and pedalcyclists).
· Approximately
40,000 people annually were injured as a result of motor
vehicle
crashes in work zones from 1995 to 1999.
· In 1999, 868
fatalities resulted from motor vehicle crashes in work zones. Twenty-six percent of these fatalities
resulted from crashes involving large trucks.
· Twenty-nine
percent of all fatal work zone crashes occurred on the weekend,
while only
13% of all fatal large truck work zone crashes occurred on the
weekend.
· In 1999,
approximately half of all fatal work zone crashes occurred during the
day, while
about two thirds of fatal large truck work zone crashes occurred
during the
day.
· Most work
zone crashes occurred in the summer and the fall.
· The
percentage of fatal work zone crashes occurring on urban interstates was
more than
twice the percentage of all fatal crashes occurring on urban
interstates
(14% vs. 6%).
· In 1999, the percentage of large truck work zone crashes occurring on urban interstates was much higher than the percentage of all fatal truck crashes occurring on urban interstates (15% vs. 9%).
· In 1999, the
majority of fatal work zone crashes occurred on roads with speed
limits of
55 miles per hour or greater.
Prepared by the FMCSA Analysis Division
April 2001
1999 Work Zone Traffic Crash Facts
INTRODUCTION
The safe and efficient flow
of traffic through construction and maintenance work zones is of particular
concern to Federal Motor Carrier Safety Administration (FMCSA). Almost 30 percent of work zone crashes
involve large trucks. Understanding
how, where and when work zone crashes occur supports our efforts to create
effective countermeasures to prevent future crashes.
The descriptive statistics
about work zone crashes presented in this report are not exhaustive, but do
provide a basic understanding of the characteristics of these crashes.
ABOUT THIS REPORT
This report presents
descriptive statistics or both work zone-related motor vehicle crashes in
general as well as work zone-related large truck crashes. In addition to the number of people injured
and killed in work zone crashes, the following information is presented:
· When fatal work zone crashes occur: Time of Day, Day of Week, Season (Tables 5-7)
· Where fatal work zone crashes occur: Roadway Function Class, Speed Limit, Type of Roadway, Roadway Alignment, Roadway Profile, Relation to Roadway (Tables 8-13).
· How fatal work zone crashes occur: Number of Vehicles, First Harmful Event, Manner of
Collision (Tables 14-16)
· The occurrence of driver violations. (Tables 17-18)
· Fatal work zone crashes by State (Table 19)
Data presented in this report
for fatal crashes were generated by the National Highway Traffic Safety
Administration’s (NHTSA) Fatality Analysis Reporting System. Data for nonfatal crashes were generated by
NHTSA’s General Estimates System.
A work zone crash is a motor vehicle traffic crash that occurs in the vicinity of highway construction, highway maintenance or utility work. The ability to identify whether a crash occurred in a work zone differs from State to State, due in large part to different definitions of a work zone.
Table 1
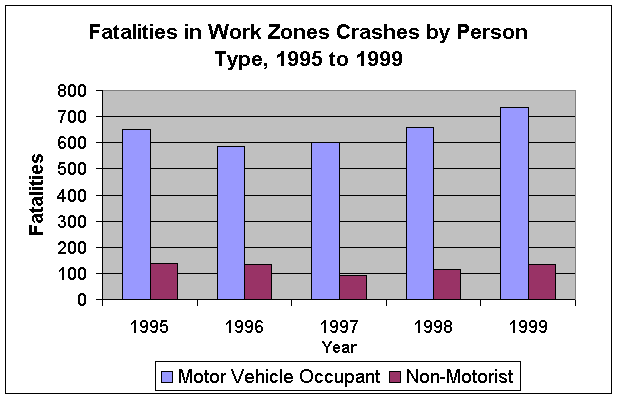
Fatalities in Work Zone Crashes by Person Type, 1995 to 1999
|
Person Type |
1995 |
1996 |
1997 |
1998 |
1999 |
5-Year Average |
|
|
Motor Vehicle Occupant |
652 |
584 |
600 |
658 |
735 |
646 |
84% |
|
Non-Motorist |
137 |
133 |
93 |
114 |
133 |
122 |
16% |
|
Total |
789 |
717 |
693 |
772 |
868 |
768 |
100% |
Source: NHTSA’s
Fatality Analysis Reporting System
· From 1995 to 1999, the number of people killed in motor vehicle crashes in work zones
has gone from a low of 693 in 1997 to a high of 868 in 1999, for an average of 768 per year.
· On average from 1995 to 1999, 16% of the fatalities resulting from crashes in work zones
were non-motorists (pedestrians and pedalcyclists).
· In 1999, 868 fatalities resulted from motor vehicle crashes in work zones, about 2% of total
fatalities (41,611).
Figure 1
Source: NHTSA’s Fatality Analysis Reporting System
Table 2
Fatalities in Large Truck Work Zone Crashes
by Person
Type, 1995 to 1999
|
Person Type |
1995 |
1996 |
1997 |
1998 |
1999 |
5-Year Average |
|
|
Truck Occupant |
21 |
23 |
17 |
33 |
36 |
26 |
13% |
|
Other Vehicle Occupants |
151 |
128 |
140 |
165 |
160 |
149 |
74% |
|
Non-Motorist |
29 |
25 |
21 |
23 |
29 |
25 |
13% |
|
Total |
201 |
176 |
178 |
221 |
225 |
200 |
100% |
Source: NHTSA’s Fatality Analysis Reporting System
· In 1999, 225 fatalities resulted from large truck crashes in work zones, about 4% of
fatalities in large truck crashes (5,362).
· Twenty-six percent of work zone fatalities that occurred in 1999 involved large trucks in
the crash. (225 out of 868)
· From 1995 to 1999, an average of 200 people were killed in large truck crashes in areas
designated as work zones, from a high of 225 deaths in 1999 to a low of 176 deaths in 1996.
· In large truck work zone crashes for the time period 1995-1999, 13% of the fatalities were
non-motorists.
Figure 2
 Source:
NHTSA’s Fatality Analysis Reporting System
Source:
NHTSA’s Fatality Analysis Reporting System
Table 3
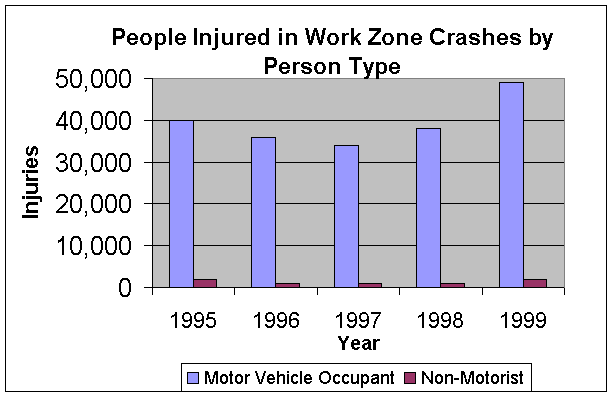
People Injured In Work Zone Crashes by Person Type, 1995 to 1999
|
Person Type |
1995 |
1996 |
1997 |
1998 |
1999 |
5-Year Average |
|
|
Motor Vehicle Occupant |
40,000 |
36,000 |
34,000 |
38,000 |
49,000 |
39,000 |
97% |
|
Non-Motorist |
2,000 |
1,000 |
1,000 |
1,000 |
2,000 |
1,000 |
3% |
|
Total |
42,000 |
37,000 |
35,000 |
39,000 |
51,000 |
40,000 |
100% |
Source: NHTSA’s General Estimates System
NOTE:
Estimates rounded to nearest thousand
· Over the last
5 years, non-motorists constituted about 3% of people injured in work zone
crashes.
Figure 3
Source: NHTSA’s Fatality Analysis Reporting System
· Approximately 50,000 people were injured as a result of motor vehicle crashes in work zones
in 1999, about 1% of the 3,236,000 injured persons in motor vehicle crashes.
Table 4
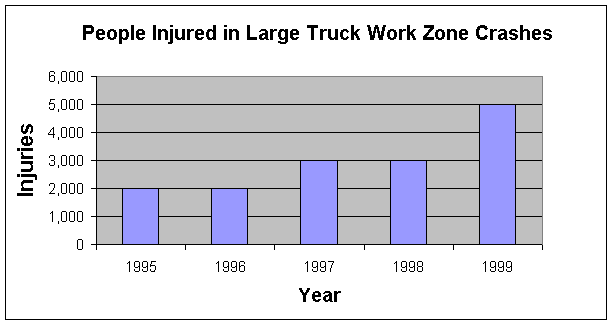
People Injured In
Large Truck Work Zone Crashes
by Person Type, 1995 to 1999
|
Person Type |
1995 |
1996 |
1997 |
1998 |
1999 |
5-Year Average |
|
Motor Vehicle Occupant |
2,000 |
2,000 |
3,000 |
3,000 |
5,000 |
3,000 |
|
Non-Motorist |
* |
* |
* |
* |
* |
* |
|
Total |
2,000 |
2,000 |
3,000 |
3,000 |
5,000 |
3,000 |
Source: NHTSA’s General Estimates System
* less than 500
injured people
NOTE: Estimates rounded to nearest thousand
· Approximately 5,000 people were injured in large truck work zone crashes in 1999, about 4%
of the 142,000 people injured in large truck crashes that year.
· About 10% of people injured in work zone traffic crashes (5,000/50,000) in 1999 were injured
in crashes involving large trucks.
Figure 4
Source: NHTSA’s Fatality Analysis Reporting System
Table 5
Fatal Crashes by Time of Day and Work Zone, 1999
|
Time of Day |
Fatal Crashes |
% |
Fatal Work Zone Crashes |
% |
Fatal Large Truck Crashes |
% |
Fatal Large Truck Work Zone Crashes |
% |
|
Night |
18,467 |
50% |
378 |
49% |
1,518 |
33% |
61 |
31% |
|
Day |
18,576 |
50% |
387 |
51% |
3,024 |
67% |
133 |
69% |
|
Total |
37,043 |
100% |
765 |
100% |
4,542 |
100% |
194 |
100% |
Source: NHTSA’s Fatality Analysis Reporting System
· Roughly half of all fatal work zone crashes occurred during the day (51%), while almost 70% of fatal large truck work zone crashes occurred during the day.
Table 6
Fatal Crashes by Day of Week and Work Zone, 1999
|
Day of Week |
Fatal Crashes |
% |
Fatal Work
Zone Crashes |
% |
Fatal Large
Truck Crashes |
% |
Fatal Large
Truck Work Zone Crashes |
% |
|
Weekend (Sat & Sun) |
12,691 |
34% |
223 |
29% |
731 |
16% |
25 |
13% |
|
Weekdays (Mon-Fri) |
24,346 |
66% |
542 |
71% |
3,811 |
84% |
169 |
87% |
|
Unknown |
16 |
0% |
0 |
0% |
0 |
0% |
0 |
0% |
Total |
37,043 |
100% |
765 |
100% |
4,542 |
100% |
194 |
100% |
Source: NHTSA’s Fatality Analysis Reporting System
· Almost three times as many work zone crashes occurred
on weekdays than on weekends.
However, based on the number of fatal
crashes in work zones per day, slightly fewer fatal
crashes occurred in work zones per weekday
(542/5=108 vs. 223/2=112). For large
trucks,
almost seven times as many fatal work zone
crashes occurred on weekdays, or about 34 per
weekday and 12 per weekend day.
Table 7
Fatal Crashes by Season and
Work Zone, 1999
|
Season |
All Fatal Crashes |
% |
Fatal Work Zone Crashes |
% |
Fatal Large Truck Crashes |
% |
Fatal Large Truck Work Zone Crashes |
% |
|
Winter |
8,216 |
22% |
121 |
16% |
968 |
21% |
19 |
10% |
|
Spring |
8,821 |
24% |
144 |
19% |
1,068 |
24% |
41 |
21% |
|
Summer |
10,079 |
27% |
260 |
34% |
1,270 |
28% |
82 |
42% |
|
Fall |
9,927 |
27% |
240 |
31% |
1,236 |
27% |
52 |
27% |
|
Total |
37,043 |
100% |
765 |
100% |
4,542 |
100% |
194 |
100% |
Source: NHTSA’s Fatality Analysis Reporting System
· Fatal work zone crashes, regardless of
whether a large truck was involved, occurred most
often in the summer and the fall. This may be the result of most work zones
being set up
in the summer and the fall.
Table 8
Fatal Crashes by Roadway Function Class and Work Zone,
1999
|
Roadway Function
Class |
Fatal Crashes |
% |
Fatal Work Zone Crashes |
% |
Fatal Large Truck Crashes |
% |
Fatal Large Truck Work Zone Crashes |
% |
|
Rural-Interstate |
2,674 |
7% |
120 |
16% |
765 |
17% |
52 |
27% |
|
Rural-Other |
19,229 |
52% |
321 |
42% |
2,359 |
52% |
85 |
44% |
|
Urban-Interstate |
2,049 |
6% |
105 |
14% |
415 |
9% |
29 |
15% |
|
Urban-Other |
12,463 |
34% |
212 |
28% |
1,036 |
23% |
25 |
13% |
|
Unknown |
628 |
2% |
7 |
1% |
51 |
1% |
3 |
2% |
|
Total |
37,043 |
100% |
765 |
100% |
4,542 |
100% |
194 |
100% |
Source: NHTSA’s Fatality Analysis Reporting System
· The majority of fatal motor vehicle crashes (59%), regardless of the vehicles involved or
whether they occurred in a work zone or not, occur in rural areas. Based on data from the
Federal Highway Administration’s Highway Statistics 1999, only 39% of all vehicle miles
traveled and 58% of all truck travel are on rural roads.
· The percentage of fatal work zone crashes occurring on urban interstates was more than
twice the percentage of all fatal crashes occurring on urban interstates (14% vs. 6%).
· For fatal large truck crashes, the percentage of work zone crashes occurring on urban
interstates was also much higher than the percentage of all fatal large truck crashes occurring
on urban interstates (15% vs. 9%).
Table 9
Fatal Crashes by Speed Limit and Work Zone, 1999
|
Speed Limit |
Fatal Crashes |
% |
Fatal Work Zone
Crashes |
% |
Fatal Large Truck Crashes |
% |
Fatal Large Truck Work Zone Crashes |
% |
|
1-50 mph |
16,818 |
45% |
281 |
37% |
1,328 |
29% |
48 |
25% |
|
55-75 mph |
19,337 |
52% |
457 |
60% |
3,154 |
69% |
139 |
72% |
|
Unknown |
888 |
3% |
27 |
4% |
60 |
1% |
7 |
3% |
|
Total |
37,043 |
100% |
765 |
100% |
4,542 |
100% |
194 |
100% |
Source: NHTSA’s Fatality Analysis Reporting System
· The majority of fatal work zone crashes for all vehicles and large trucks occurred on roads
with speed limits of 55 miles per hour or greater (60% and 72%, respectively).


